finance, business, economy and statistic navy blue and pink background. moving up and growth concept. - 線形圖 幅插畫檔、美工圖案、卡通及圖標抽象, 營業額
Line chart, Chart used to depict the evolution of data over a period of time, using a line formed by joining the points of data.
futuristic data skyline: neon bar cityscape visualization for tech, analytics, and innovation - 線形圖 個照片及圖片檔抽象, 城市, 紫色
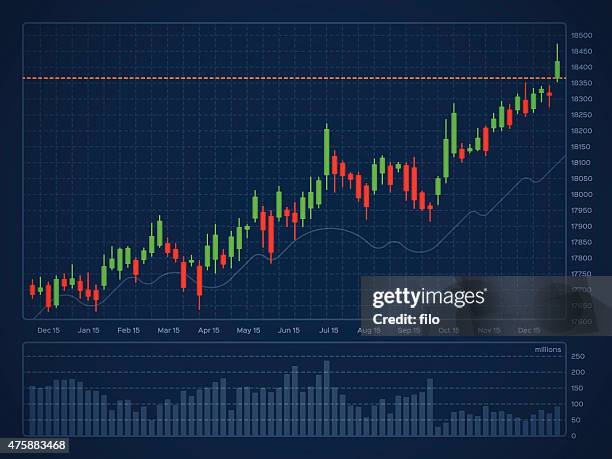
candlestick financial analysis trading chart with downward trend line. analysis charts for investment, trading, forex, crypto and stock market. - 線形圖 幅插畫檔、美工圖案、卡通及圖標金融
financial chart two color line icon with editable stroke. the icon is suitable for web design, mobile apps, ui, ux, and gui design. - 線形圖 幅插畫檔、美工圖案、卡通及圖標簡單
futuristic colorful wavy motion background, rippled curved flowing pattern, with square shape particulars. 3d illustration. - 線形圖 個照片及圖片檔抽象, 技術, 背景 - 主題
chart and diagram thin line icons. editable stroke. pixel perfect. for mobile and web. - 線形圖 幅插畫檔、美工圖案、卡通及圖標圓形統計圖
abstract stock market data background with red and green candlestick chart, bar graph, rising and falling arrow symbols, trading board interface, bitcoin cryptocurrency exchange, global finance investment analysis, banking economy technology dashboard, bu - 線形圖 幅插畫檔、美工圖案、卡通及圖標
business professional interacting with stock market touchscreen display showing finance and cryptocurrency charts - 線形圖 個照片及圖片檔
ai analyzing big data, filtering noise and transforming chaotic signals into structured output - 線形圖 幅插畫檔、美工圖案、卡通及圖標金融, 矢量圖, 背景 - 主題
accountant working on a laptop with financial graphs in the background - editable stroke and solid icons - 線形圖 幅插畫檔、美工圖案、卡通及圖標手提電腦, 一個人
reporting line icon set. group of object. sales report, annual report, financial report, progress report, daily report, data sheet, analytics report, marketing report. - 線形圖 幅插畫檔、美工圖案、卡通及圖標報告 - 文件, 線條畫, 圓形統計圖
stock commodity price value decrease loss recession failure chart data - 線形圖 幅插畫檔、美工圖案、卡通及圖標股市崩盤, 經濟, 加密貨幣