investor using digital tablet to track stock market volatility and trading signals financial data monitoring on touchscreen device with ai system - 圖表 個影片檔及 b 捲影像00:09
close-up businesswoman using digital tablet analyzing business data financial analysts - 圖表 個影片檔及 b 捲影像00:26
stock market valuation going up, down, financial crisis, economic growth and decline with nature background. - 圖表 個影片檔及 b 捲影像00:11
infographic financial business diagram and graph with charts and stock numbers showing profits and losses over time dynamically, a finance 4k 3d animation, concept illustrates corporate business growth - 4k stok video - 圖表 個影片檔及 b 捲影像00:15
couple listening to a businessman, banker or financial advisor who has a laptop computer. - 圖表 個影片檔及 b 捲影像00:14
close-up young asian businessman and businesswoman look at computer discussing chart report in presentation and compare on digital tablet at small business workplace overtime working at night. - 圖表 個影片檔及 b 捲影像00:20
engineer data science apply information coding business data prompts for ai models on platform showcasing the development of machine learning and natural language processing. ai training processes. 2026 - 圖表 個影片檔及 b 捲影像00:18
close up digital device screen of data analyst team of marketing from social media platforms. - 圖表 個影片檔及 b 捲影像00:05
two business men meeting and looking at financial data, charts and graphs on a digital tablet and a laptop computer. - 圖表 個影片檔及 b 捲影像00:15辦公室
close up of businessman using a laptop with graphs and charts on a laptop computer. - 圖表 個影片檔及 b 捲影像00:15辦公室
ls electronic screens showing changing stock prices at bovespa stock exchange / sao paulo, brazil - 圖表 個影片檔及 b 捲影像00:15
paperwork and hands on a board room table at a business presentation or seminar. - 圖表 個影片檔及 b 捲影像00:26
concept piece of italy travel and tourism industry declining due to coronavirus pandemic and worsening economic conditions for the country shown with negative chart and stock market performance data - 圖表 個影片檔及 b 捲影像00:20
4k stop motion of stack of coins representing financial growth, savings and investment success - 圖表 個影片檔及 b 捲影像00:06
black and white grid of pie charts, bar graphs, and line graphs. background of business data analytics, dashboard interface, market statistics, abstract infographics, and modern digital financial reporting. - 圖表 個影片檔及 b 捲影像00:20
data, applause and woman with tablet, presentation or celebration for info on monitor, app or sales. clapping, audience and success for people in meeting, charts and financial analyst with smile - 圖表 個影片檔及 b 捲影像00:12會展中心, 女人
professional analyzes financial data on a tablet, utilizing the power of ai and machine learning to unlock actionable business insights. - 圖表 個影片檔及 b 捲影像00:18
investor adjusting machine learning algorithms on a tablet device in ai development using modern tools to making the best investment portfolio - 圖表 個影片檔及 b 捲影像00:24互聯網, 辦公室
graphic animation of graph showing fluctuated upward and downward trend, upward green arrow and downward red arrow chart. - 圖表 個影片檔及 b 捲影像00:36紅色, 綠色
close-up group of business working late, analyzing financial reports and charts on digital tablet surrounded by documents and graphs during strategic meeting at office night. finance meeting. - 圖表 個影片檔及 b 捲影像00:12
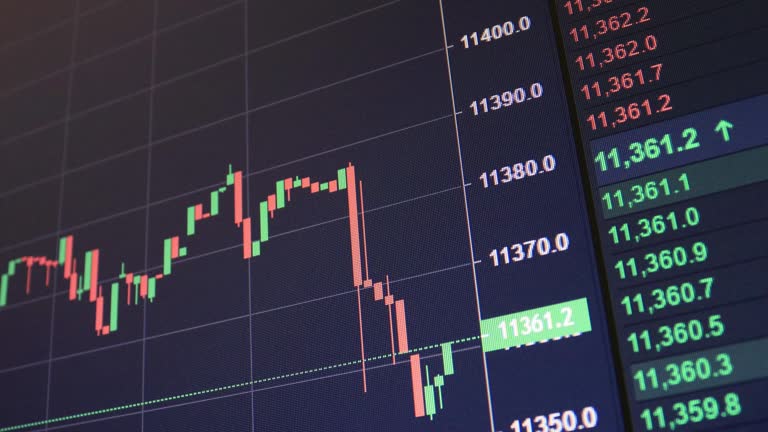
moving financial chart with downtrend line candlestick graph and numbers in stock market on black color monitor - 圖表 個影片檔及 b 捲影像00:15
digital finance evolution. innovative fintech technology. visualizing financial investment. stock market trading monitor - 圖表 個影片檔及 b 捲影像00:12
graphic animation of graph showing fluctuated upward and downward trend, upward green arrow and downward red arrow chart. - 圖表 個影片檔及 b 捲影像00:09
investment concepts, stock charts, cryptocurrencies, forex economic inflation, on a computer screen, time-lapse video. - 圖表 個影片檔及 b 捲影像00:16
imaginative visual of business data and financial figures graphic, 4k animation. - 圖表 個影片檔及 b 捲影像00:09紫色
ms r/f asian woman giving presentation, men and woman watching presentation in background / los angeles, ca, united states - 圖表 個影片檔及 b 捲影像00:16
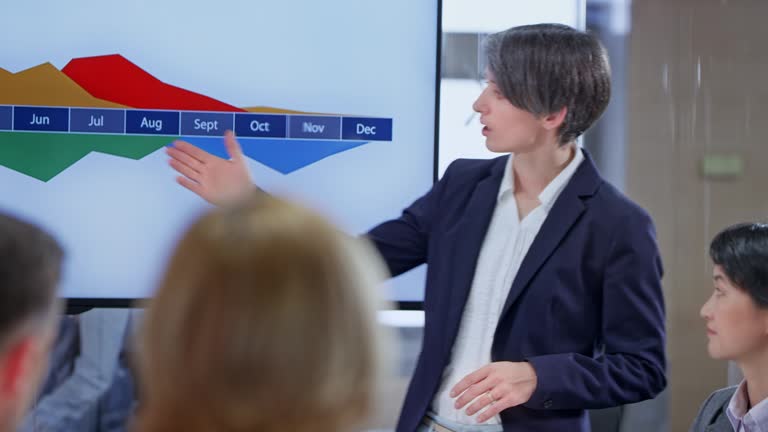
intelligent businesswoman explains data graphs as she leads a team business meeting, coworkers take notes and ask questions - 圖表 個影片檔及 b 捲影像00:07